Move data from one place to another
Automatically share your Metrics between your team’s workspaces without having to double your workload by inputting KPIs twice. During your Weekly Meeting, Metrics is automatically displayed at the right time with the right data.
Understand complex data at a glance
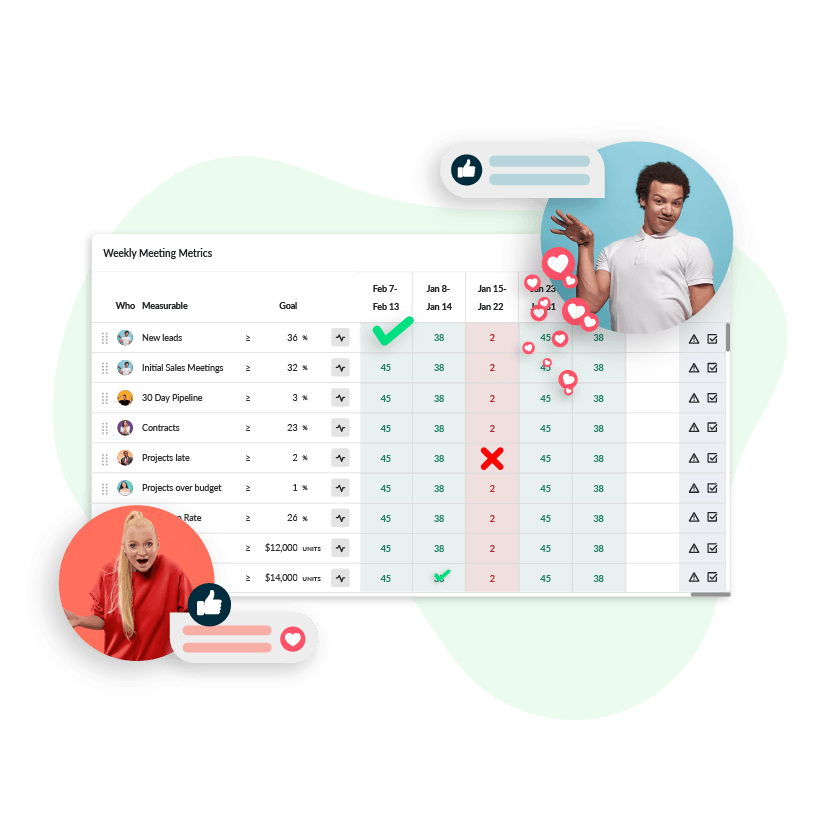
Get immediate insight into your metrics as your cumulative and average numbers are intuitively displayed. Identify trends, call out numbers that are on or off track, and review past KPIs measurables.
Customize display to fit your needs
No screen is set in stone. Reorder information however you want, using metrics, weekly data and color-coding to visualize progress.
Do more with your metrics
Spreadsheets can be hard to read—key company numbers get buried and trends are tough to spot. Metrics makes data accessible, interpretable and easy. With Bloom’s KPI tracking software, you can:
- Color-code numbers to know what’s on—and off—track at a glance
- View data from the previous 13 weeks to reveal trends
- Access archived data forever
- Track and share KPIs in multiple meetings

Get more from your business
Schedule a free discovery call to discuss your unique business goals and pain points. In just 30 minutes, we’ll uncover your biggest challenges and provide a tailored strategy with tools to help you streamline operations, maximize accountability, and accelerate growth.

